Vertical stress beneath loads: Boussinesq vs. Westergaard
When a footing, wheel, tank or embankment loads the ground, the vertical stress in the soil below goes up. The increase is largest just under the load and spreads out and fades with depth. This is the familiar "pressure bulb". Engineers need that increase, Δσz, to estimate settlement, check buried structures and size surcharge pressures. This page explains the two classical elastic solutions, how to apply them to rectangular loads, and how to check your numbers by hand.
Skip the hand calculation. ZEDstress computes Boussinesq and Westergaard stresses for up to 16 point loads, 16 rectangles and 30 points.
Run it free in ZEDstress1. Stress in an elastic half-space
The classical solutions model the ground as a half-space: a mass bounded by a flat horizontal surface that extends without limit sideways and downward. The material is taken as linear-elastic, and the load is applied at the surface (or, by extension, at some depth). The solutions give only the increase in stress caused by the applied load. You add it to the existing (geostatic) effective stress to get the final stress.
Two results make these solutions so useful in practice. First, for a load applied normal to the surface of a homogeneous isotropic half-space, the vertical stress increase does not depend on the elastic modulus, and in Boussinesq's case not on Poisson's ratio either. You don't need soil stiffness to estimate Δσz. Second, because the material is linear, the effects of separate loads simply add (superposition). Any loaded area can therefore be built up from point loads or rectangles.
2. A short history
In 1885 the French mathematician and physicist Joseph Valentin Boussinesq published the solution for a concentrated force on the surface of a semi-infinite, homogeneous, isotropic elastic solid. It appeared in his Application des potentiels à l'étude de l'équilibre et du mouvement des solides élastiques. Soil mechanics adopted it decades later as the standard way to estimate how foundation loads spread with depth.
In 1935 Nathan M. Newmark integrated Boussinesq's point-load solution over a uniformly loaded rectangle. That gave engineers a closed-form "corner" influence factor, which is still the basis of most hand and spreadsheet calculations.
In 1938 Harald M. Westergaard asked a different question. What if the soil is stratified, with thin, stiff layers that stop it from straining sideways? His solution, published in the Timoshenko 60th anniversary volume, models an elastic material reinforced by numerous closely spaced, rigid horizontal sheets.
In 1948 R. E. Fadum presented influence-value charts for both theories, including rectangle-corner solutions for Westergaard. Those charts made side-by-side comparison routine in practice.
3. Boussinesq vs. Westergaard: assumptions and when to use each
| Boussinesq (1885) | Westergaard (1938) | |
|---|---|---|
| Material | Homogeneous, isotropic, linear-elastic half-space | Elastic half-space reinforced by thin, rigid, closely spaced horizontal sheets |
| Lateral strain | Allowed | Prevented (zero horizontal strain) |
| Poisson's ratio ν | Δσz independent of ν | Enters through η² = (1−2ν)/(2−2ν); ν = 0 is the usual choice (as in Fadum's charts and ZSTRESS) |
| Stress right under the load | Higher | Lower (about ⅔ of Boussinesq for a point load with ν = 0) |
| Typical use | Most soils without strong layering; the common default | Strongly stratified deposits: varved clays, clay with thin sand or silt seams, interbedded layers |
Both are idealisations. Boussinesq is the usual default and tends to be the more conservative (higher) estimate directly beneath a load. Westergaard suits strongly layered ground, where stiff seams restrain lateral movement and the load spreads out more. Many engineers compute both and use the pair to bracket the likely answer.
4. Coordinate system
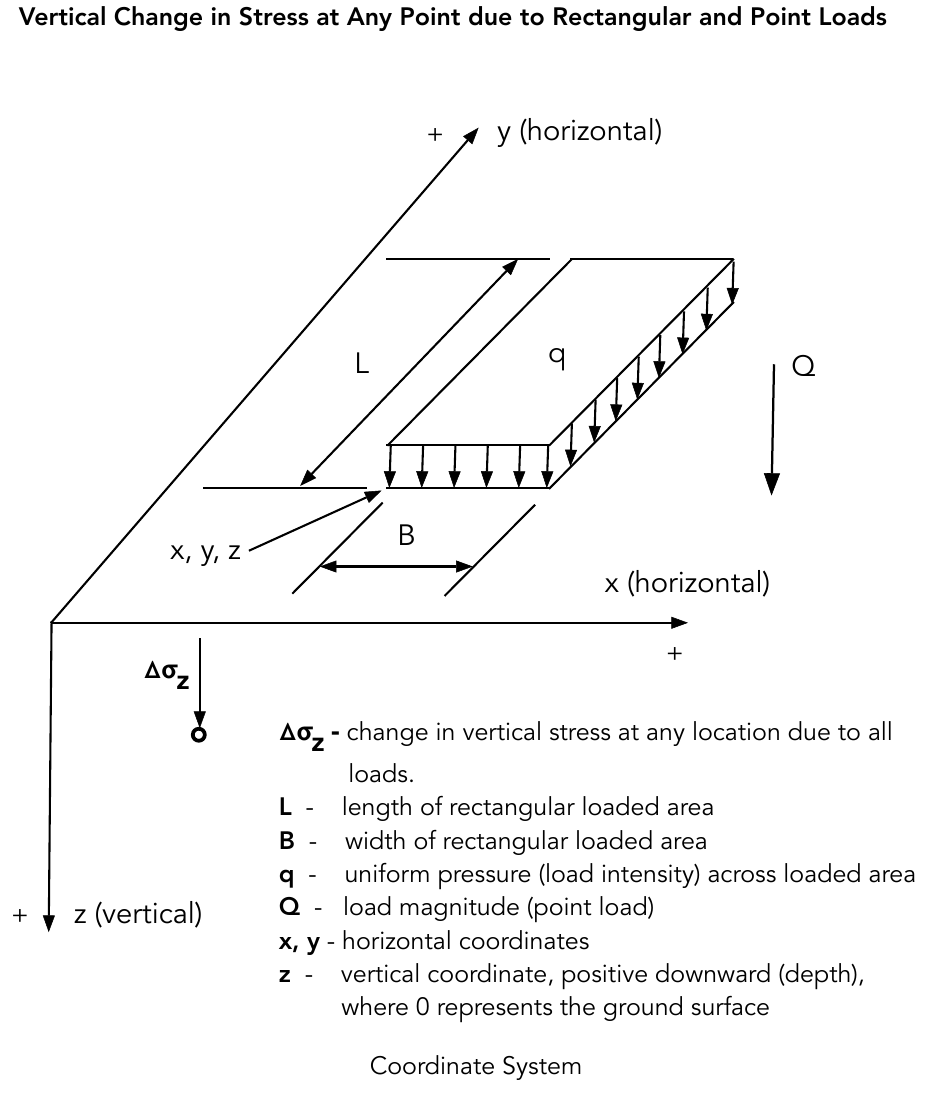
The equations below use x and y in plan and depth z, positive downward from the ground surface. For a point load, r is the horizontal distance from the load to the point where stress is wanted. A rectangular load is located by one corner, with width B along x and length L along y.
5. Point-load equations
For a vertical point load Q at the surface, the vertical stress increase at depth z and horizontal offset r is:
Directly beneath the load (r = 0), Boussinesq gives 3Q/(2πz²) and Westergaard (ν = 0) gives Q/(πz²). The Westergaard value is exactly two-thirds of the Boussinesq value. Further out, the two curves cross, and at large r/z Westergaard predicts the larger stress.
6. Rectangular loads: the corner method
For a uniform pressure q on a rectangle, integrating the point-load solution gives the stress under one corner as q times an influence factor I. Write the factor in terms of m = B/z and n = L/z, where B and L are the rectangle's sides and z is the depth below the corner.
The stress under the center of a B × L rectangle is four times the corner value for a B/2 × L/2 rectangle. In general, split the loaded area at the point's plan position into rectangles that each have a corner there, and add up their contributions.
7. Superposition and points outside the loaded area
Because the solutions are linear, the stress from several loads is just the sum of the individual stresses. The same idea handles a point that is not under the loaded area. Draw rectangles that all share a corner at the point's plan projection. Add the ones that cover the real load and subtract the extra areas you included to make the shapes rectangular.
Signs handle themselves. A rectangle that runs from the point "backwards" in x or y counts as negative. With signed corner rectangles, one rule works for points inside, on the edge of, or outside any rectangle.
8. Worked examples (US units)
Example 1: point load, 10,000 lb, stress 10 ft directly below
Q = 10,000 lb, z = 10 ft, r = 0.
Boussinesq: Δσz = 3Q / (2πz²) = 3 × 10,000 / (2π × 100) = 30,000 / 628.3 = 47.7 psf
Westergaard (ν = 0): Δσz = Q / (πz²) = 10,000 / (π × 100) = 10,000 / 314.2 = 31.8 psf
Westergaard is ⅔ of Boussinesq directly under a point load. At r = 5 ft (r/z = 0.5) the values are 27.3 psf and 17.3 psf.
Example 2: 10 × 10 ft footing at 2,000 psf, 10 ft below the center
Split the footing into four 5 × 5 ft rectangles, each with a corner under the center. At z = 10 ft: m = n = 5/10 = 0.5.
Boussinesq: IB(0.5, 0.5) = 0.0840, so Δσz = 4 × 2,000 × 0.0840 = 672 psf (about 34% of the contact pressure).
Westergaard (ν = 0): IW(0.5, 0.5) = (1/2π)·tan⁻¹(√2 × 0.25 / √1.0) = 0.0541, so Δσz = 4 × 2,000 × 0.0541 = 433 psf.
For comparison, the rough 2:1 spread gives 2,000 × 10² / 20² = 500 psf. That is an average over the spread area, not the peak under the center.
Example 3: the same footing, 5 ft outside an edge
Put the footing at 0 ≤ x ≤ 10 ft, 0 ≤ y ≤ 10 ft, and take the point at (15, 5) at 10 ft depth. Use two 15 × 5 rectangles (m = 1.5, n = 0.5) minus two 5 × 5 rectangles (m = n = 0.5):
Boussinesq: 2 × 2,000 × (0.1314 − 0.0840) = 189 psf. Westergaard: 2 × 2,000 × (0.0875 − 0.0541) = 133 psf.
ZEDstress reproduces all of these values (672.22 and 432.69 psf for Example 2) and handles many loads and points at once.
Check your own loads. Up to 16 point loads, 16 rectangles and 30 stress points, both methods side by side, CSV export.
Run it free in ZEDstress9. Limitations
- The results are the stress increase from the applied load. Add the existing overburden stress separately.
- The solutions assume a uniform half-space (or Westergaard's idealised layering). A stiff layer over soft soil, or soft over stiff, changes the stresses noticeably. Use layered-system solutions or numerical analysis for those cases.
- The rectangle solutions assume a flexible load with uniform pressure. A rigid footing has a different contact-pressure distribution, though the stresses converge with depth.
- Results are elastic estimates for engineering guidance. Verify them against project-specific analysis and the judgment of a licensed engineer.
ZSTRESS and ZEDstress
Many engineers know these calculations from ZSTRESS (also written Zstress), the vertical stress program from Virginia Tech (J. Michael Duncan). ZEDstress uses the same basis as ZSTRESS: Boussinesq and Westergaard solutions for point loads and uniform rectangular loads, combined by superposition.
Is ZEDstress the same as Virginia Tech ZSTRESS?
No. ZEDstress follows the same method as ZSTRESS, but it is an independent implementation. ZEDstress is not affiliated with, endorsed by, or an official version of Virginia Tech's software.
ZSTRESS was developed at Virginia Tech's Center for Geotechnical Practice and Research (Yan & Duncan). This page is written in grateful memory of J. Michael Duncan, University Distinguished Professor Emeritus at Virginia Tech, whose teaching and tools shaped generations of geotechnical engineers.
10. References
- Boussinesq, J. (1885). Application des potentiels à l'étude de l'équilibre et du mouvement des solides élastiques. Gauthier-Villars, Paris.
- Newmark, N. M. (1935). "Simplified computation of vertical pressures in elastic foundations." University of Illinois Engineering Experiment Station, Circular No. 24.
- Westergaard, H. M. (1938). "A problem of elasticity suggested by a problem in soil mechanics: soft material reinforced by numerous strong horizontal sheets." In Contributions to the Mechanics of Solids (Stephen Timoshenko 60th Anniversary Volume), Macmillan, New York.
- Fadum, R. E. (1948). "Influence values for estimating stresses in elastic foundations." Proceedings, 2nd International Conference on Soil Mechanics and Foundation Engineering, Rotterdam, Vol. 3.
- Yan, B., and Duncan, J. M. ZSTRESS 2.0. Center for Geotechnical Practice and Research (CGPR), Virginia Tech.